Female education gap

The workplace seniority gap

How do we reach gender parity in the professions of the future?

Women’s political empowerment

Share of women in labor force/skilled roles

Violence against women


Global Gender Gap Index 2016
The highest possible score is 1 (equality) and the lowest possible score is 0 (inequality)
Rank |
Economy |
Score |
1 |
Iceland |
0.874 |
2 |
Finland |
0.845 |
3 |
Norway |
0.842 |
4 |
Sweden |
0.815 |
5 |
Rwanda |
0.800 |
6 |
Ireland |
0.797 |
7 |
Philippines |
0.786 |
8 |
Slovenia |
0.786 |
9 |
New Zealand |
0.781 |
10 |
Nicaragua |
0.780 |
11 |
Switzerland |
0.776 |
12 |
Burundi |
0.768 |
13 |
Germany |
0.766 |
14 |
Namibia |
0.765 |
15 |
South Africa |
0.764 |
16 |
Netherlands |
0.756 |
17 |
France |
0.755 |
18 |
Latvia |
0.755 |
19 |
Denmark |
0.754 |
20 |
United Kingdom |
0.752 |
21 |
Mozambique |
0.750 |
22 |
Estonia |
0.747 |
23 |
Bolivia |
0.746 |
24 |
Belgium |
0.745 |
25 |
Lithuania |
0.744 |
26 |
Moldova |
0.741 |
27 |
Cuba |
0.740 |
28 |
Barbados |
0.739 |
29 |
Spain |
0.738 |
30 |
Belarus |
0.737 |
31 |
Portugal |
0.737 |
32 |
Costa Rica |
0.736 |
33 |
Argentina |
0.735 |
34 |
Luxembourg |
0.734 |
35 |
Canada |
0.731 |
36 |
Cape Verde |
0.729 |
37 |
Bahamas |
0.729 |
38 |
Poland |
0.727 |
39 |
Colombia |
0.727 |
40 |
Ecuador |
0.726 |
41 |
Bulgaria |
0.726 |
42 |
Jamaica |
0.724 |
43 |
Lao PDR |
0.724 |
44 |
Trinidad and Tobago |
0.723 |
45 |
United States |
0.722 |
46 |
Australia |
0.721 |
47 |
Panama |
0.721 |
48 |
Serbia |
0.720 |
49 |
Israel |
0.719 |
50 |
Italy |
0.719 |
51 |
Kazakhstan |
0.718 |
52 |
Austria |
0.716 |
53 |
Tanzania |
0.716 |
54 |
Botswana |
0.715 |
55 |
Singapore |
0.712 |
56 |
Zimbabwe |
0.710 |
57 |
Lesotho |
0.706 |
58 |
Mongolia |
0.705 |
59 |
Ghana |
0.705 |
60 |
Madagascar |
0.704 |
61 |
Uganda |
0.704 |
62 |
Albania |
0.704 |
63 |
Kenya |
0.702 |
64 |
El Salvador |
0.702 |
65 |
Vietnam |
0.70 |
66 |
Mexico |
0.70 |
67 |
Malawi |
0.70 |
68 |
Croatia |
0.70 |
69 |
Ukraine |
0.70 |
70 |
Chile |
0.699 |
71 |
Thailand |
0.699 |
72 |
Bangladesh |
0.698 |
73 |
Macedonia, FYR |
0.696 |
74 |
Venezuela |
0.694 |
75 |
Russian Federation |
0.691 |
76 |
Romania |
0.690 |
77 |
Czech Republic |
0.690 |
78 |
Honduras |
0.690 |
79 |
Brazil |
0.687 |
80 |
Peru |
0.687 |
81 |
Kyrgyz Republic |
0.687 |
82 |
Senegal |
0.685 |
83 |
Bosnia and Herzegovina |
0.685 |
84 |
Cyprus |
0.684 |
85 |
Cameroon |
0.684 |
86 |
Azerbaijan |
0.684 |
87 |
India |
0.683 |
88 |
Indonesia |
0.682 |
89 |
Montenegro |
0.681 |
90 |
Georgia |
0.681 |
91 |
Uruguay |
0.681 |
92 |
Greece |
0.680 |
93 |
Tajikistan |
0.679 |
94 |
Slovak Republic |
0.679 |
95 |
Suriname |
0.679 |
96 |
Paraguay |
0.676 |
97 |
Dominican Republic |
0.676 |
98 |
Belize |
0.676 |
99 |
China |
0.676 |
100 |
Sri Lanka |
0.673 |
101 |
Hungary |
0.669 |
102 |
Armenia |
0.669 |
103 |
Brunei Darussalam |
0.669 |
104 |
Gambia, The |
0.667 |
105 |
Guatemala |
0.666 |
106 |
Malaysia |
0.666 |
107 |
Swaziland |
0.665 |
108 |
Malta |
0.664 |
109 |
Ethiopia |
0.662 |
110 |
Nepal |
0.661 |
111 |
Japan |
0.660 |
112 |
Cambodia |
0.658 |
113 |
Mauritius |
0.652 |
114 |
Liberia |
0.652 |
115 |
Maldives |
0.650 |
116 |
Korea, Rep. |
0.649 |
117 |
Angola |
0.643 |
118 |
Nigeria |
0.643 |
119 |
Qatar |
0.643 |
120 |
Algeria |
0.642 |
121 |
Bhutan |
0.642 |
122 |
Guinea |
0.640 |
123 |
Burkina Faso |
0.640 |
124 |
United Arab Emirates |
0.639 |
125 |
Timor-Leste |
0.637 |
126 |
Tunisia |
0.636 |
127 |
Benin |
0.636 |
128 |
Kuwait |
0.624 |
129 |
Mauritania |
0.624 |
130 |
Turkey |
0.623 |
131 |
Bahrain |
0.615 |
132 |
Egypt |
0.614 |
133 |
Oman |
0.612 |
134 |
Jordan |
0.603 |
135 |
Lebanon |
0.598 |
136 |
Cote d’Ivoire |
0.597 |
137 |
Morocco |
0.597 |
138 |
Mali |
0.591 |
139 |
Iran, Islamic Rep. |
0.587 |
140 |
Chad |
0.587 |
141 |
Saudi Arabia |
0.583 |
142 |
Syria |
0.567 |
143 |
Pakistan |
0.556 |
144 |
Yemen |
0.516 |


Men and women disagree on the cause of tech’s diversity problem.
We asked founders to pinpoint the main driver behind women and ethnic minorities being underrepresented in tech. While men and women agreed on some factors, they diverged on others. Men are more likely to blame the pipeline into tech; women place greater emphasis on unconscious bias and lack of role models.

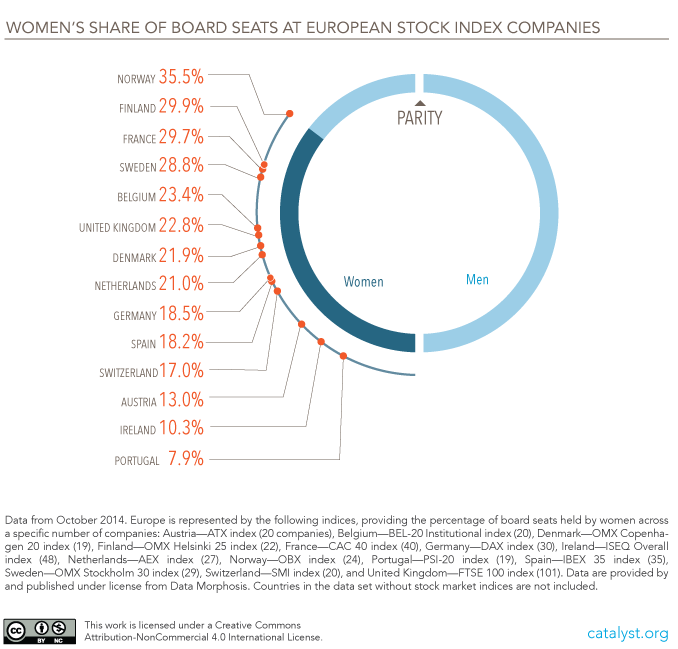
Women’s Share of Board Seats at European Stock Index Companies